Getting Started with Tables
Mastering your tables has never been easier!
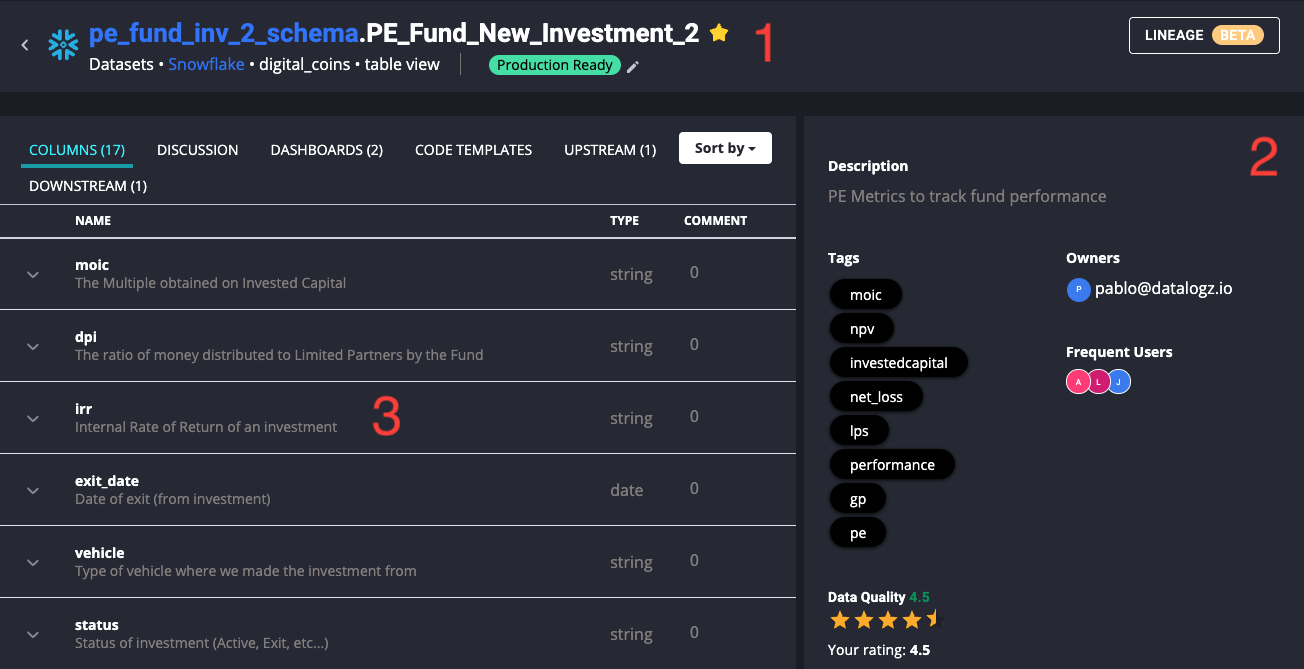
Datalogz is divided into three panels (numbers in red) to make your experience fast and seamless.
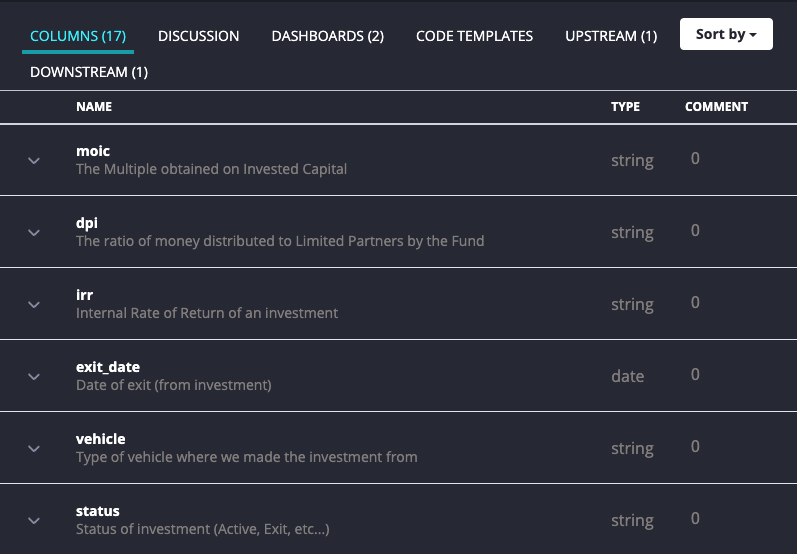
1 The Top Banner displays the table's name, location, lineage map and displays the badges if there are any for this data. 2 There is an overview panel on the right side of the platform that focuses on giving the user a high-level summary of important aspects of the data table. 3 The panel on the left-hand side is the context and collaboration panel which contains our column documentation, dashboard, discussion, Code Templates, and lineage features.
Top Banner
Data asset name whether it's a table or dashboard.
Data Lineage map which is explained in greater detail here
Badges are displayed as well. Badges are explained in greater detail here
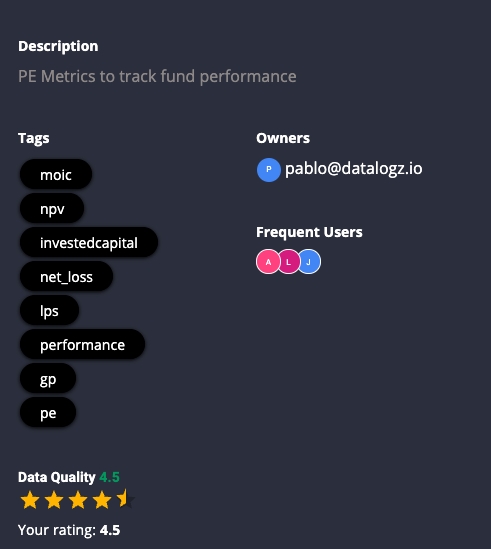
Overview Panel:
The overview panel gives you a high-level summary of any data table. It provides the following resources:
Description: The asset description gives context into the table, dashboard, report etc...
Owners: The owners of that data asset would be visible in this section. Owners serve as a primary point of contact for anything related to this table, dashboard, or report. The owner usually makes sure that asset is up to date with all the relevant context.
Frequent User: The frequent user serves as a secondary point of contact for this data asset. This could be an SME or someone who has interacted with this asset recently.
Tags: Tags help you find and bucket different assets across your org to help with discovery. The data assets shows all the tags which have been tagged against this asset.
Key Dates: That assets dates of first published/edited for everyone to know how up-to-date is that asset.
Data Quality: An aggregate score of the quality of the data.
Last updated